A density plot is an alternative to Histogram used for visualizing the distribution of a continuous variable.
The peaks of a Density Plot help to identify where values are concentrated over the interval of the continuous variable.
Compared to Histograms, Density Plots are better at finding the distribution shape because they are re not affected by the number of bins used (each bar used in a typical histogram).
For example, a Histogram with only 4 bins wouldn’t produce a distinguishable enough shape of distribution as a 30-bin Histogram would. However, with Density Plots, this isn’t an issue.
This article describes how to create density plots using the ggplot2 R package.
Contents:
Related Book
GGPlot2 Essentials for Great Data Visualization in RKey R functions
- Key function:
geom_density()(for density plots). - Key arguments to customize the plots:
color, size, linetype: change the line color, size and type, respectivelyfill: change the areas fill color (for bar plots, histograms and density plots)alpha: create a semi-transparent color.
Data preparation
Create some data (wdata) containing the weights by sex (M for male; F for female):
set.seed(1234)
wdata = data.frame(
        sex = factor(rep(c("F", "M"), each=200)),
        weight = c(rnorm(200, 55), rnorm(200, 58))
        )

head(wdata, 4)
## sex weight
## 1 F 53.8
## 2 F 55.3
## 3 F 56.1
## 4 F 52.7Compute the mean weight by sex using the dplyr package. First, the data is grouped by sex and then summarized by computing the mean weight by groups. The operator %>% is used to combine multiple operations:
library("dplyr")
mu <- wdata %>%
  group_by(sex) %>%
  summarise(grp.mean = mean(weight))
mu
## # A tibble: 2 x 2
## sex grp.mean
## <fct> <dbl>
## 1 F 54.9
## 2 M 58.1Loading required R package
Load the ggplot2 package and set the default theme to theme_classic() with the legend at the top of the plot:
library(ggplot2)
theme_set(
  theme_classic() +
    theme(legend.position = "top")
  )
Basic density plots
We start by creating a plot, named a, that we’ll finish in the next section by adding a layer using the function geom_density().
a <- ggplot(wdata, aes(x = weight))The following R code creates some basic density plots with a vertical line corresponding to the mean value of the weight variable (geom_vline()):
# Basic density plots
# y axis scale = stat(density) (default behaviour)
a + geom_density() +
geom_vline(aes(xintercept = mean(weight)), linetype = "dashed")
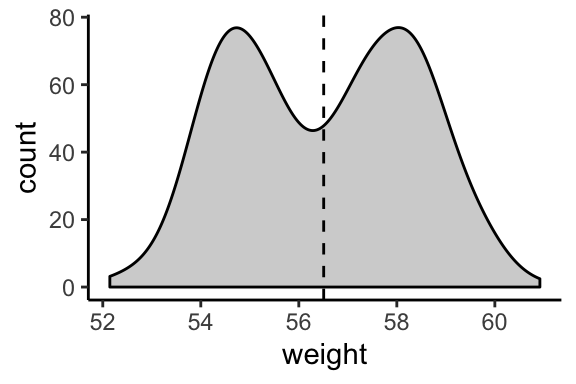
# Change y axis to count instead of density
a + geom_density(aes(y = stat(count)), fill = "lightgray") +
geom_vline(aes(xintercept = mean(weight)), linetype = "dashed")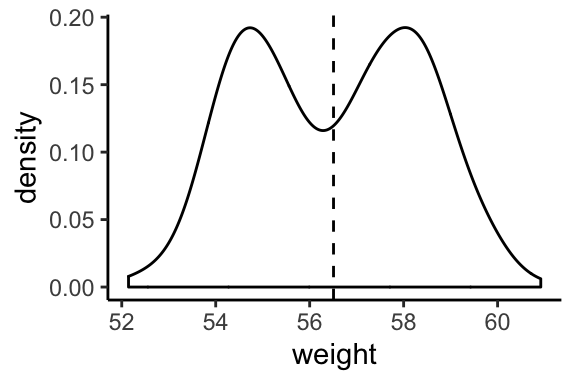
Change color by groups
The following R code will change the density plot line and fill color by groups. The functions scale_color_manual() and scale_fill_manual() are used to specify custom colors for each group.
We’ll proceed as follow:
- Change areas fill and add line color by groups (sex)
- Add vertical mean lines using
geom_vline(). Data:mu, which contains the mean values of weights by sex (computed in the previous section). - Change color manually:
- use
scale_color_manual()orscale_colour_manual()for changing line color - use
scale_fill_manual()for changing area fill colors.
- use
# Change line color by sex
a + geom_density(aes(color = sex)) +
  scale_color_manual(values = c("#868686FF", "#EFC000FF"))

# Change fill color by sex and add mean line
# Use semi-transparent fill: alpha = 0.4
a + geom_density(aes(fill = sex), alpha = 0.4) +
  geom_vline(aes(xintercept = grp.mean, color = sex), data = mu, linetype = "dashed") +
  scale_color_manual(values = c("#868686FF", "#EFC000FF"))+
  scale_fill_manual(values = c("#868686FF", "#EFC000FF"))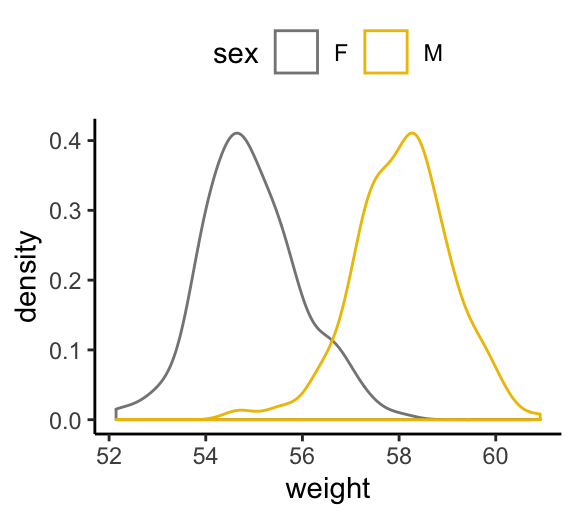

Recommended for you
This section contains best data science and self-development resources to help you on your path.
Books - Data Science
Our Books
- Practical Guide to Cluster Analysis in R by A. Kassambara (Datanovia)
- Practical Guide To Principal Component Methods in R by A. Kassambara (Datanovia)
- Machine Learning Essentials: Practical Guide in R by A. Kassambara (Datanovia)
- R Graphics Essentials for Great Data Visualization by A. Kassambara (Datanovia)
- GGPlot2 Essentials for Great Data Visualization in R by A. Kassambara (Datanovia)
- Network Analysis and Visualization in R by A. Kassambara (Datanovia)
- Practical Statistics in R for Comparing Groups: Numerical Variables by A. Kassambara (Datanovia)
- Inter-Rater Reliability Essentials: Practical Guide in R by A. Kassambara (Datanovia)
Others
- R for Data Science: Import, Tidy, Transform, Visualize, and Model Data by Hadley Wickham & Garrett Grolemund
- Hands-On Machine Learning with Scikit-Learn, Keras, and TensorFlow: Concepts, Tools, and Techniques to Build Intelligent Systems by Aurelien Géron
- Practical Statistics for Data Scientists: 50 Essential Concepts by Peter Bruce & Andrew Bruce
- Hands-On Programming with R: Write Your Own Functions And Simulations by Garrett Grolemund & Hadley Wickham
- An Introduction to Statistical Learning: with Applications in R by Gareth James et al.
- Deep Learning with R by François Chollet & J.J. Allaire
- Deep Learning with Python by François Chollet
Version:
 Français

No Comments