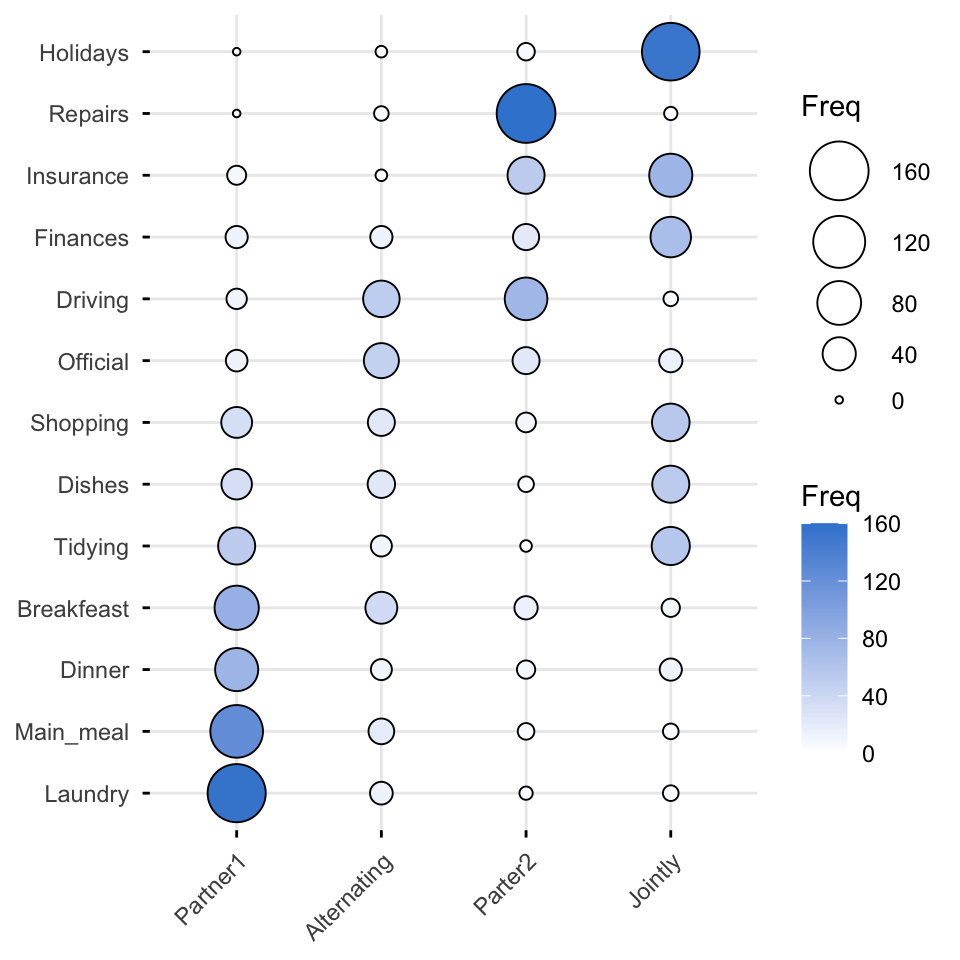
The Categorical Data series: analyse counts and contingency tables in R — the chi-square tests of independence and goodness-of-fit, Fisher’s exact test, McNemar and Cochran’s Q for paired data, Cochran-Mantel-Haenszel for stratified data, and the odds ratio & relative risk — with rstatix, base R, and on-plot p-values.
Categorical data are counts — how many observations fall into each category. This series analyses them the way the work happens: build a contingency table, test whether two categorical variables are associated (chi-square, Fisher), handle paired designs (McNemar, Cochran’s Q), control for a third variable (Cochran-Mantel-Haenszel), and quantify risk with the odds ratio & relative risk — with the tidy rstatix helpers, base R shown alongside, and the p-values on the plot.
The chi-square test in one minute
The workhorse: does an outcome depend on a grouping variable? Cross-tabulate, then chisq.test():
Ask Prova“which categorical test fits my data?” — it answers with the right test (chi-square, Fisher, McNemar, CMH, odds ratio) and rstatix code you can run on your own counts. The runtime is the judge.Ask Prova →
Was this page helpful?
Thanks for the feedback!
Prove you can do it. Master the whole Categorical Analysis in R series — track your path, build projects, and earn a certificate.