What Is Survival Analysis? Censoring, Hazard & Survival
A gentle introduction to survival analysis in R. Understand time-to-event data (time to death, relapse, or discharge), why right-censoring breaks a t-test or linear…
The complete, practical guide to survival analysis in R — censoring and time-to-event data, Kaplan-Meier curves, the log-rank test, and the Cox proportional-hazards model, with publication-ready survminer visuals. Recipe-first, reproducible, clinician-friendly.
Learn › Biostatistics › Survival Analysis
Survival analysis answers a question ordinary statistics can’t: how long until something happens — and what changes that time? Time to death, to relapse, to discharge, to a part failing. The catch is censoring: when the study ends, many patients are still alive, so you know they survived at least this long but not their true event time. A t-test or a linear model throws that information away; survival methods use it. This is the complete, modernized guide to time-to-event analysis in R — every method as a recipe you can run, with publication-ready survminer curves you can paste straight into a paper.
A · Fundamentals
Censoring · hazard & survival functions
B · Curves (KM)
Kaplan-Meier · median survival · publication curves
C · Comparing groups
Log-rank · stratified & weighted tests
D · Cox regression
Hazard ratios · PH assumptions · model building
E · Advanced
Competing risks · RMST · parametric & frailty
The guide follows the same journey as a survival-analysis course, in order:
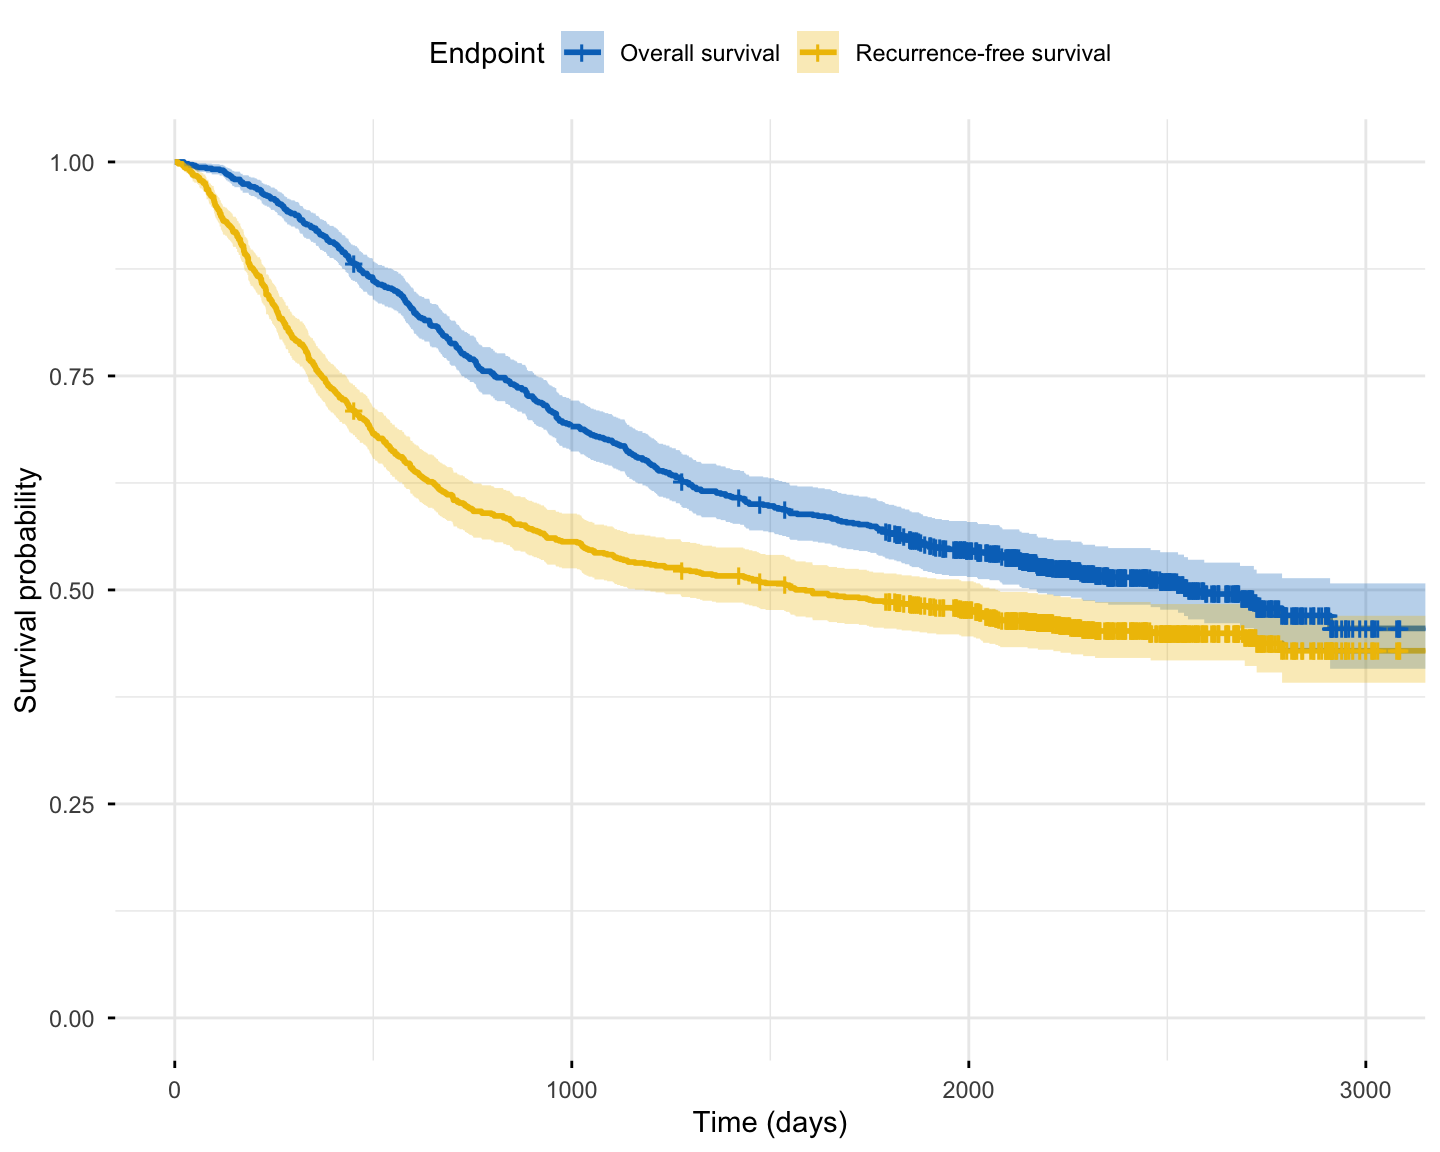
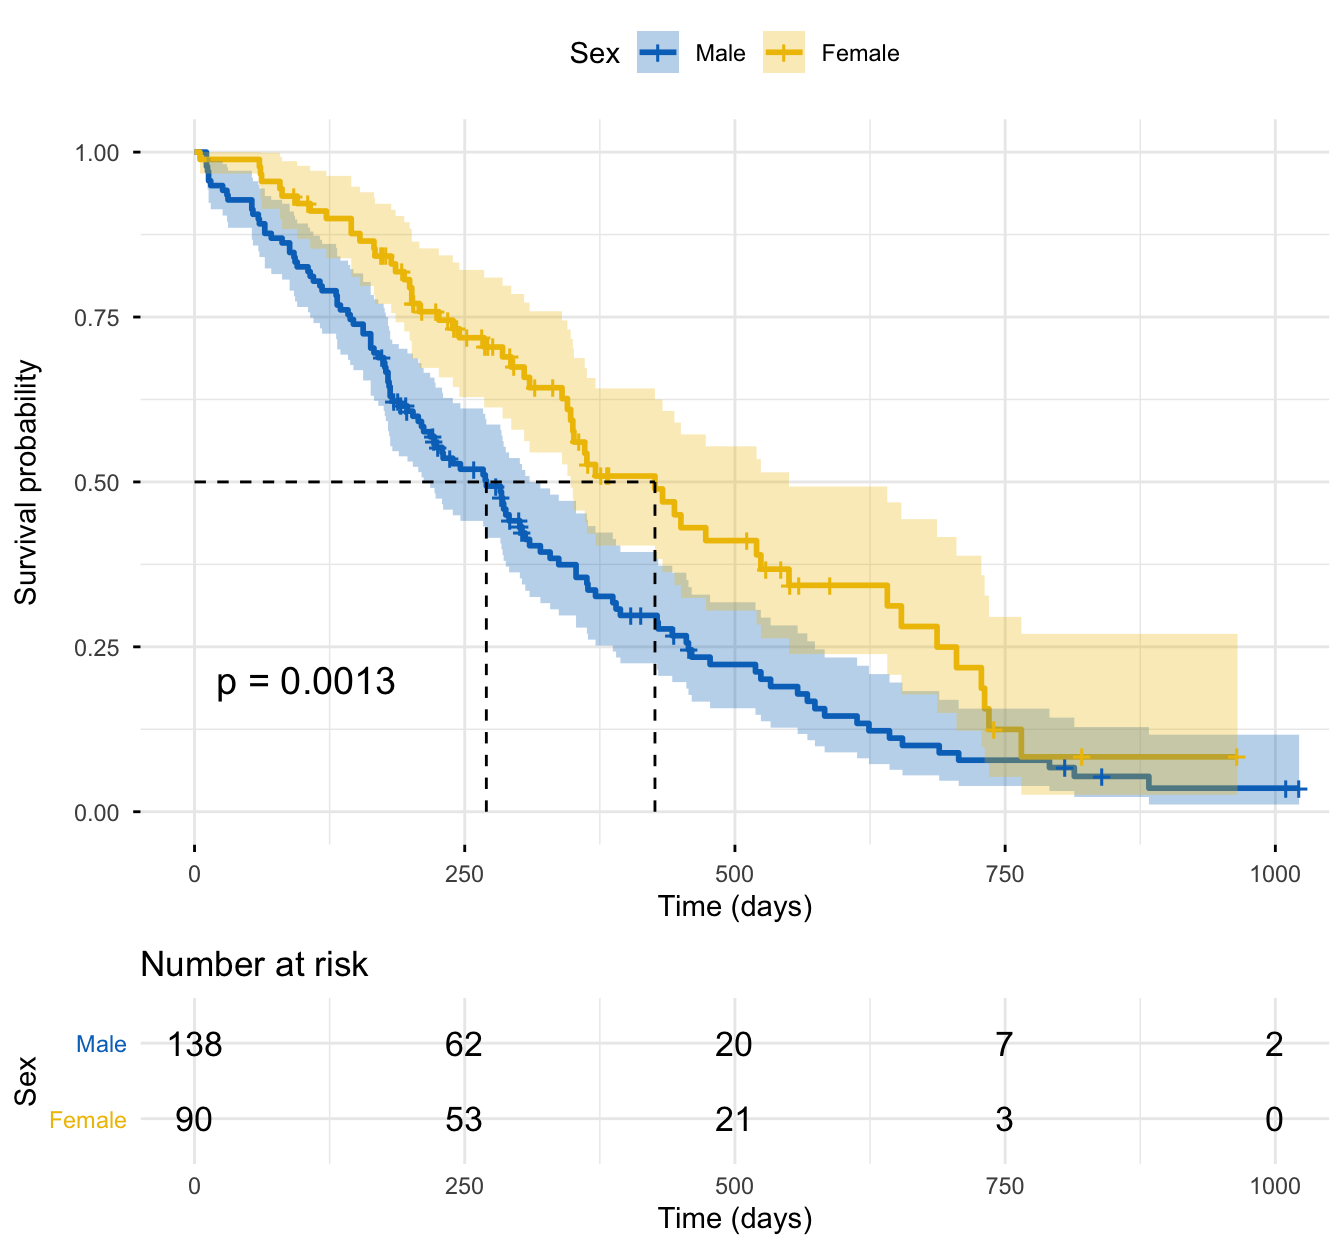
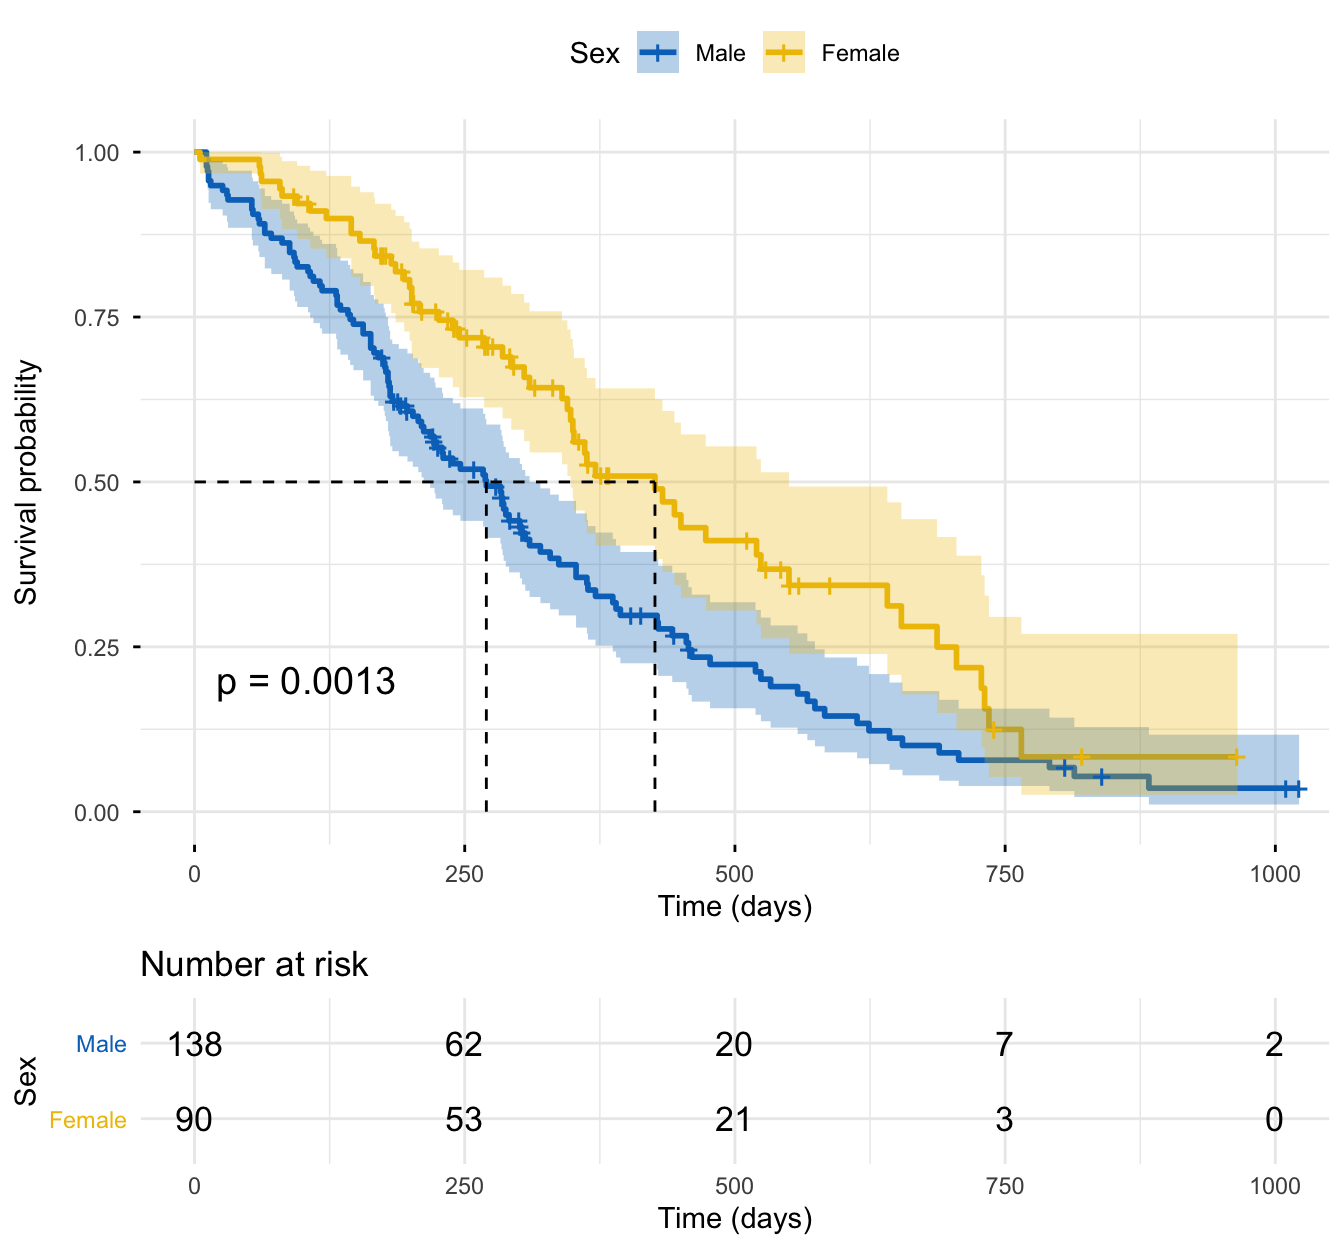
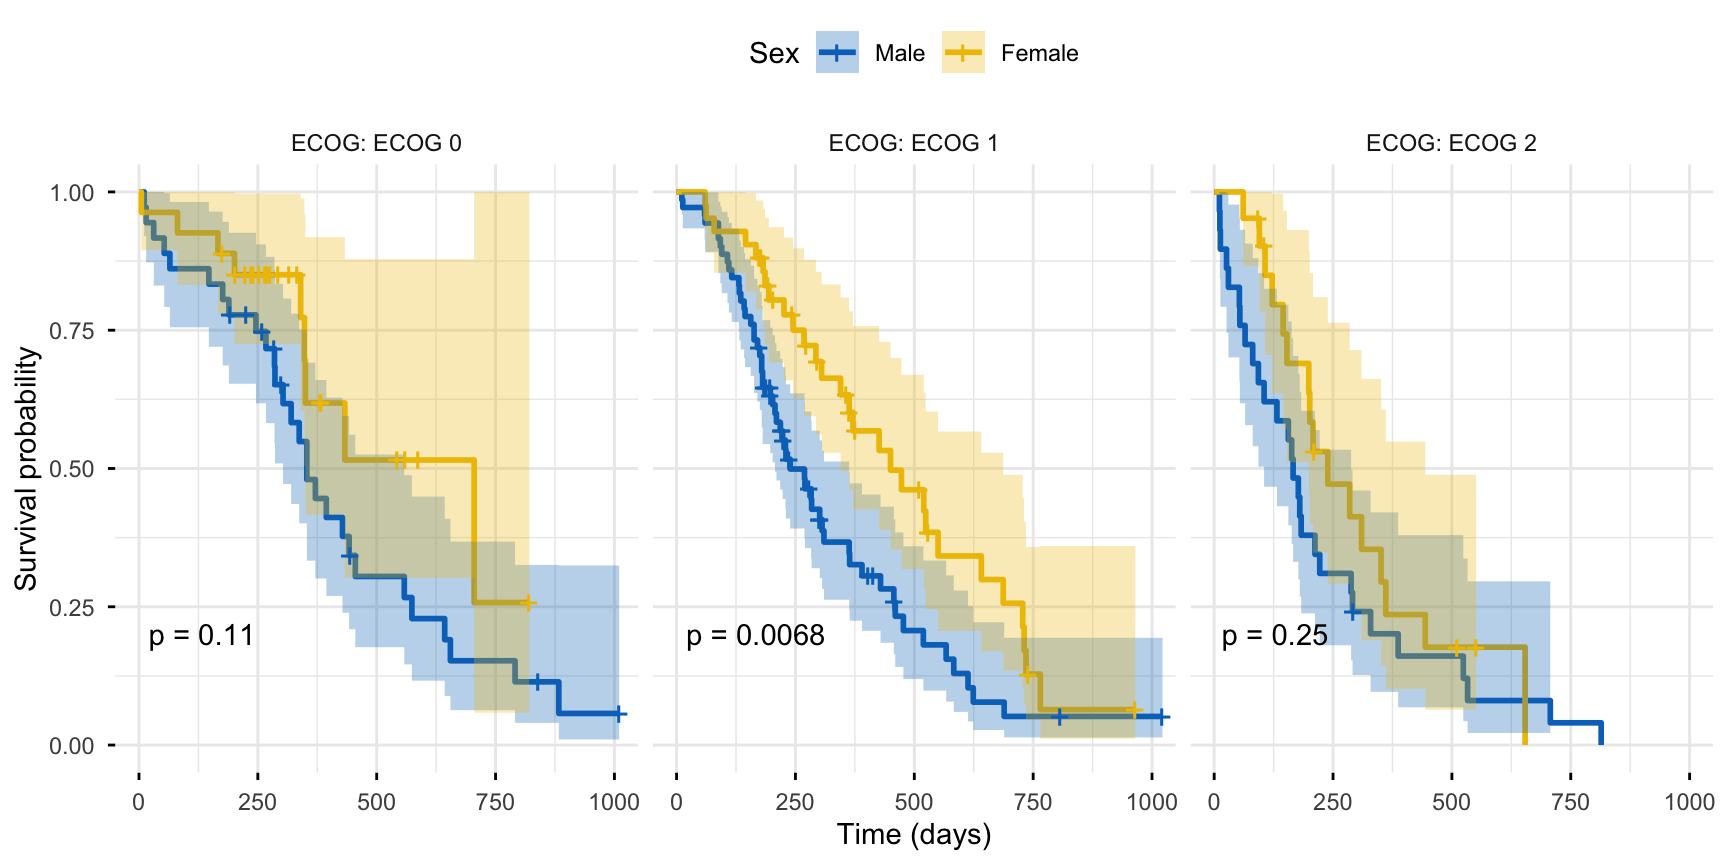
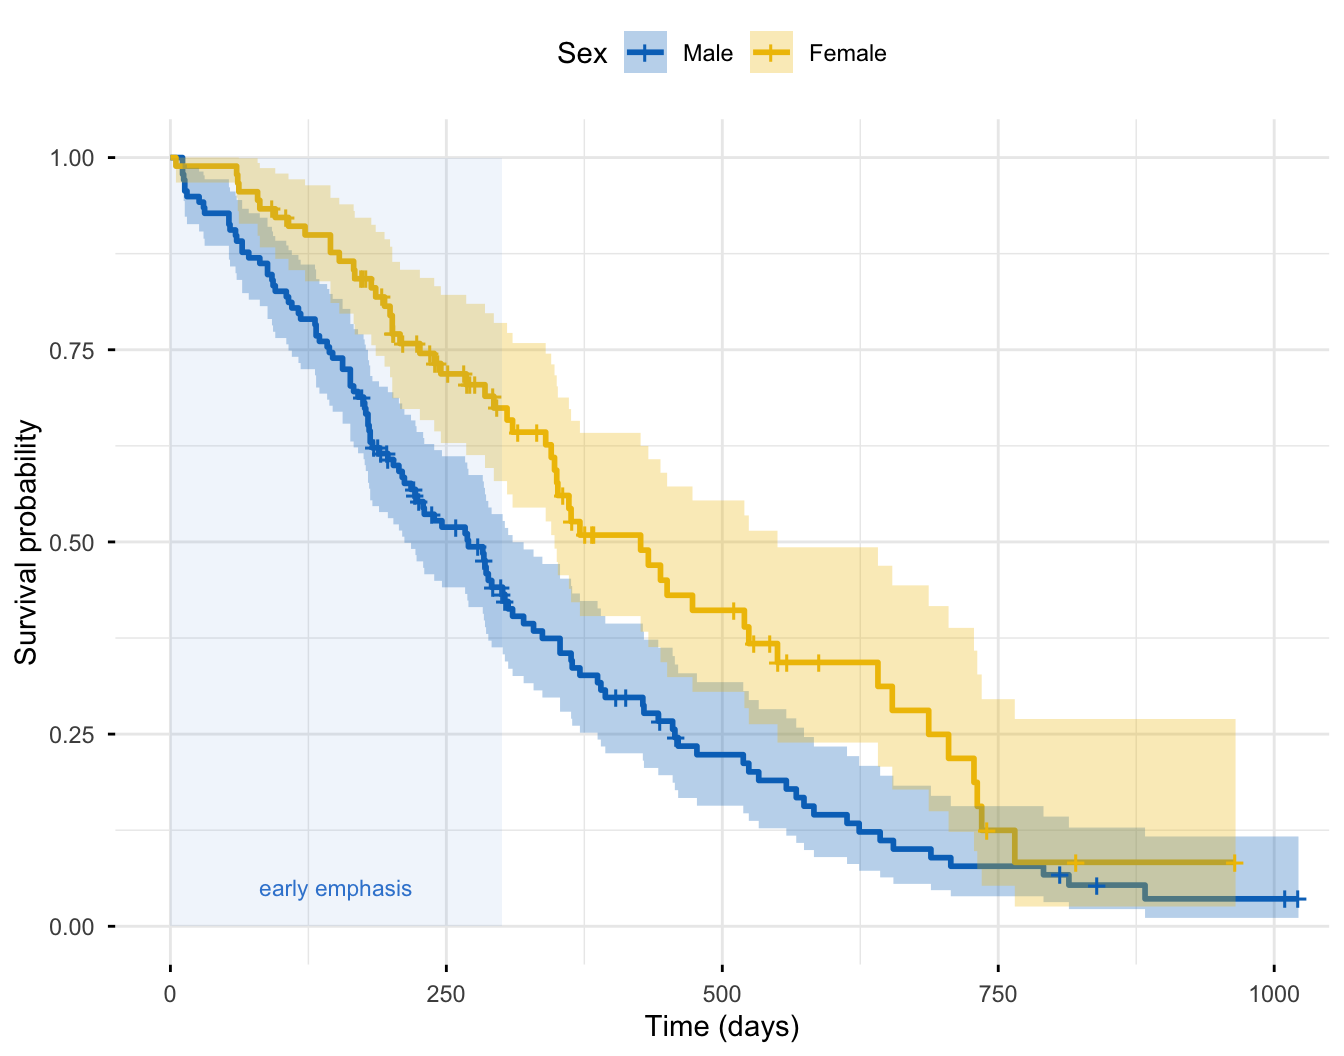
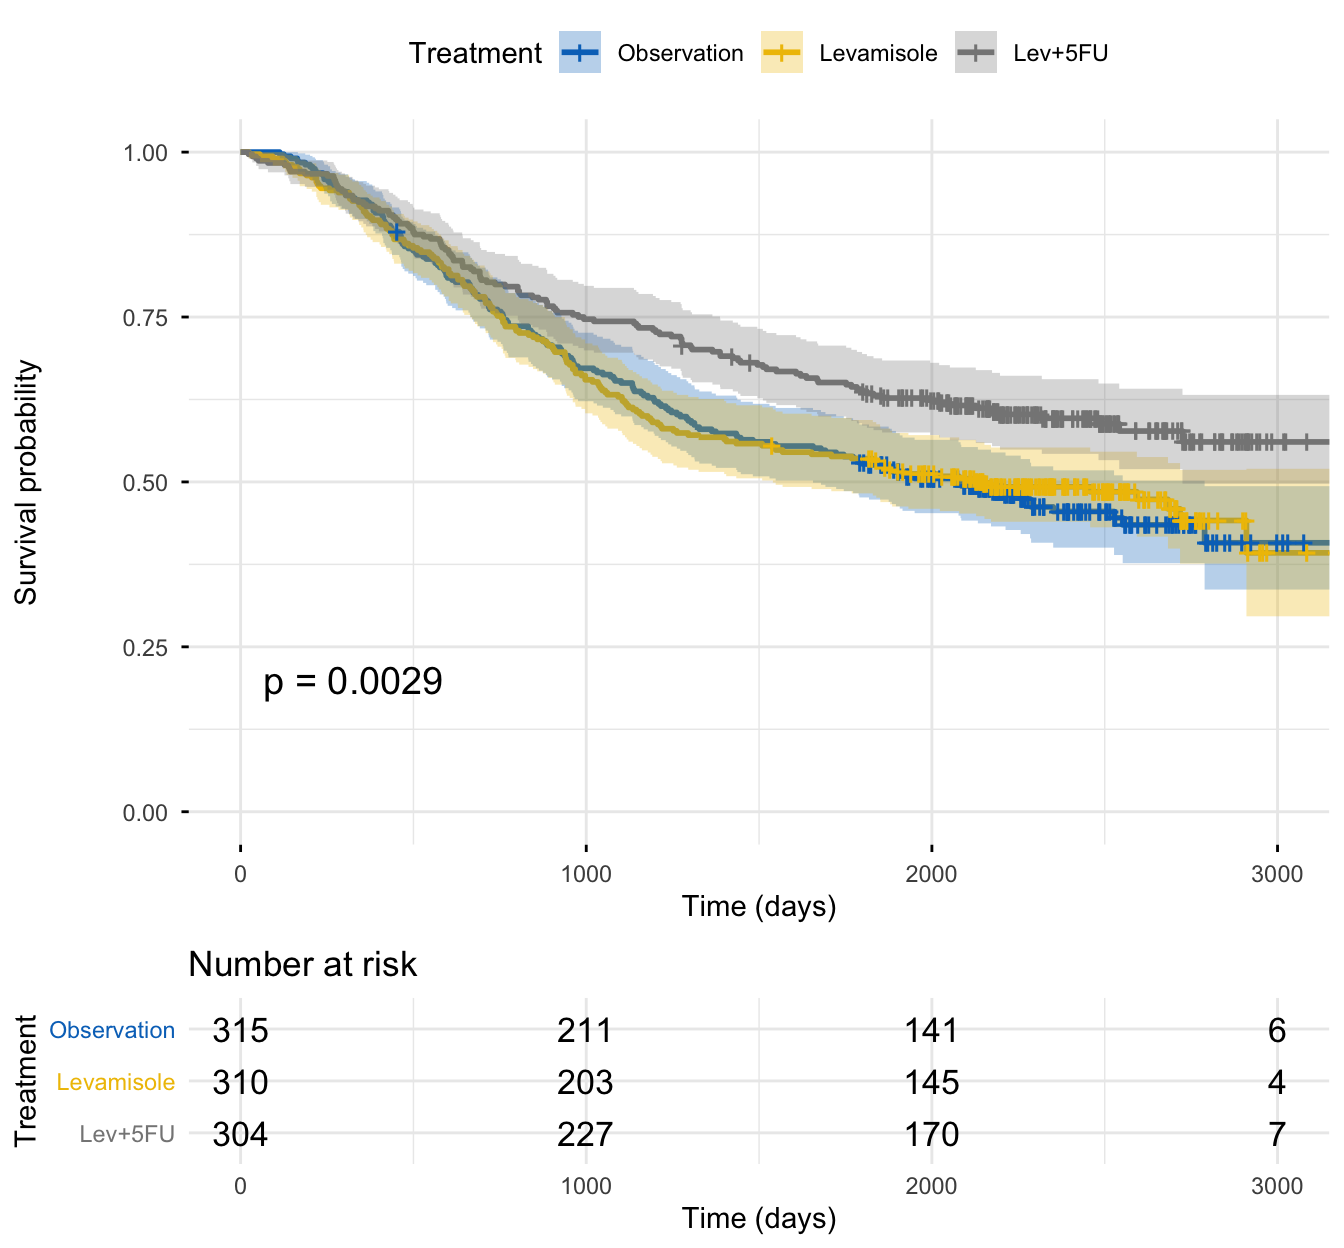
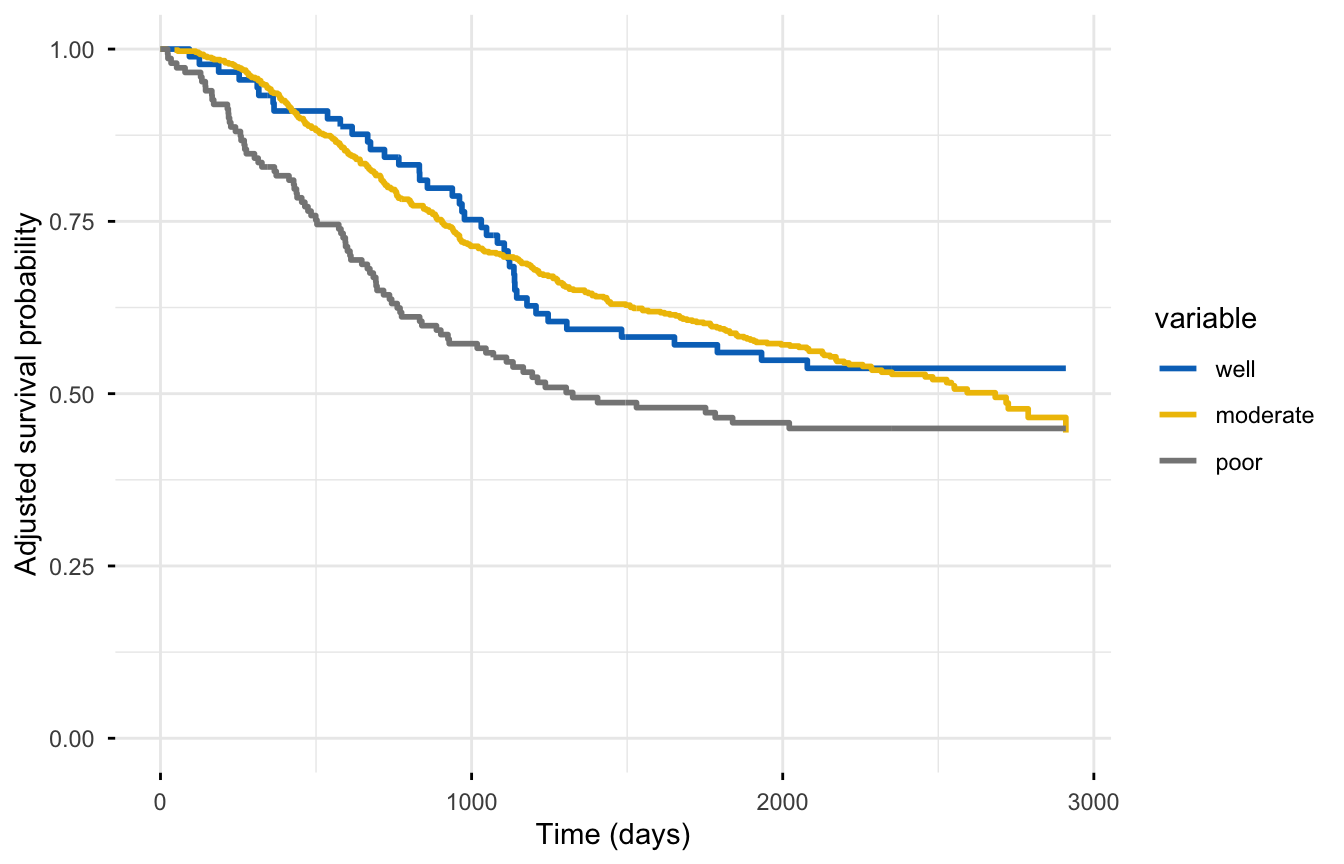
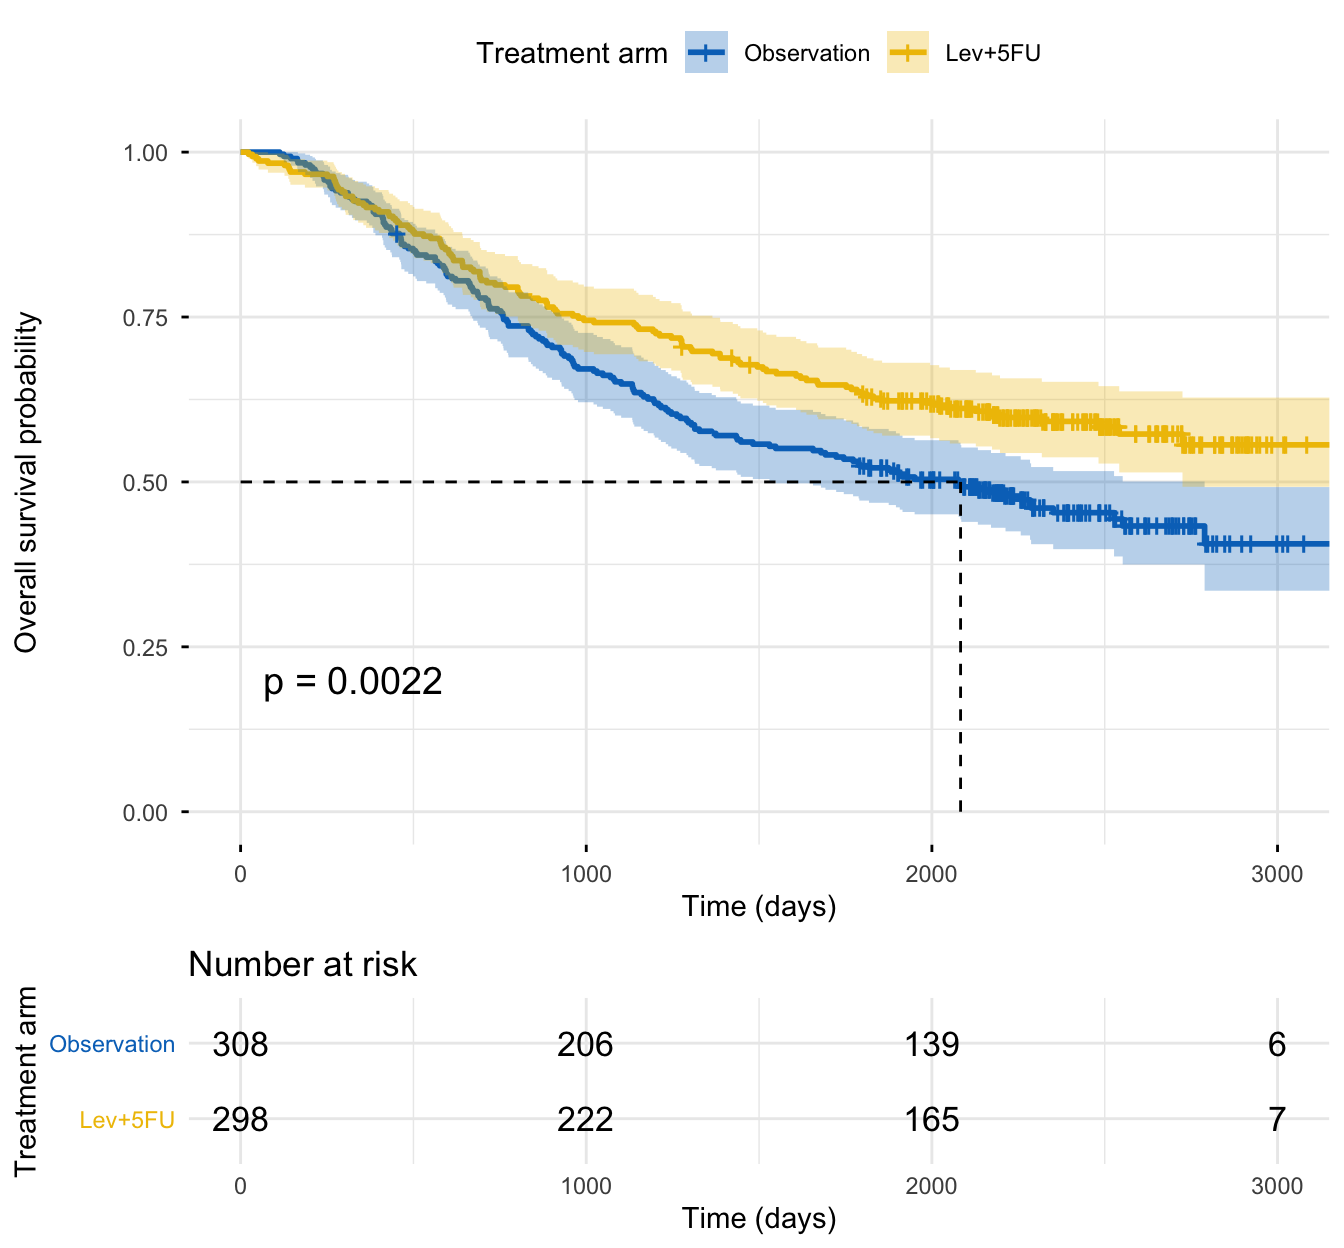
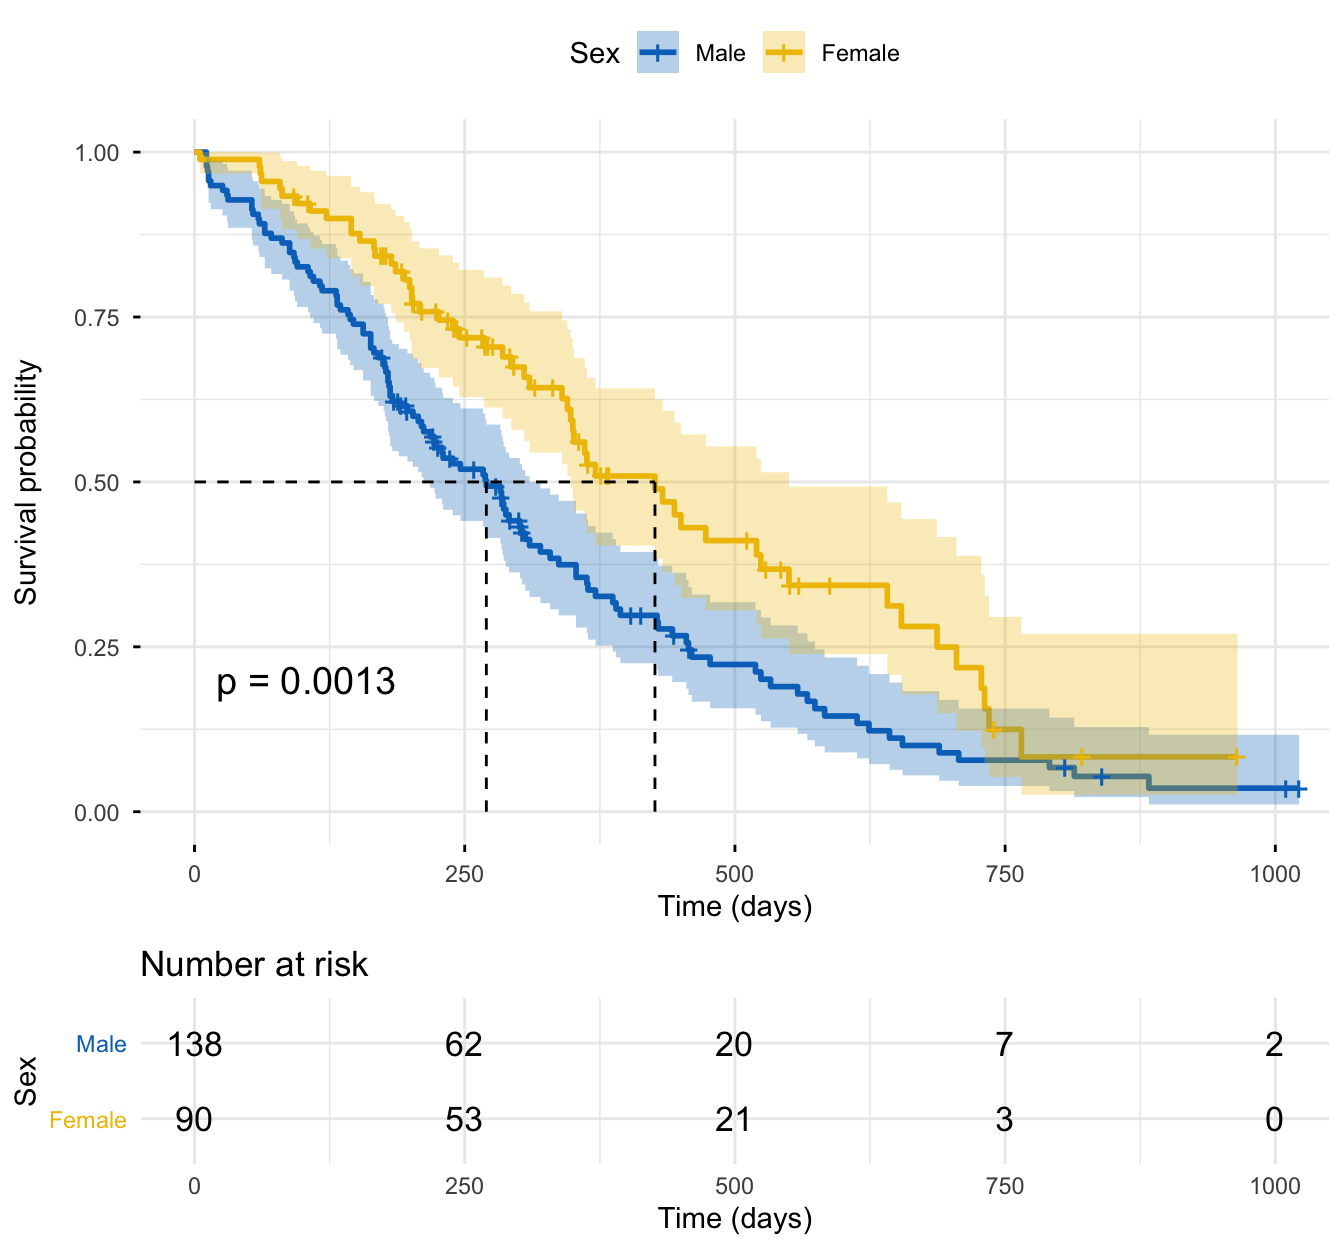
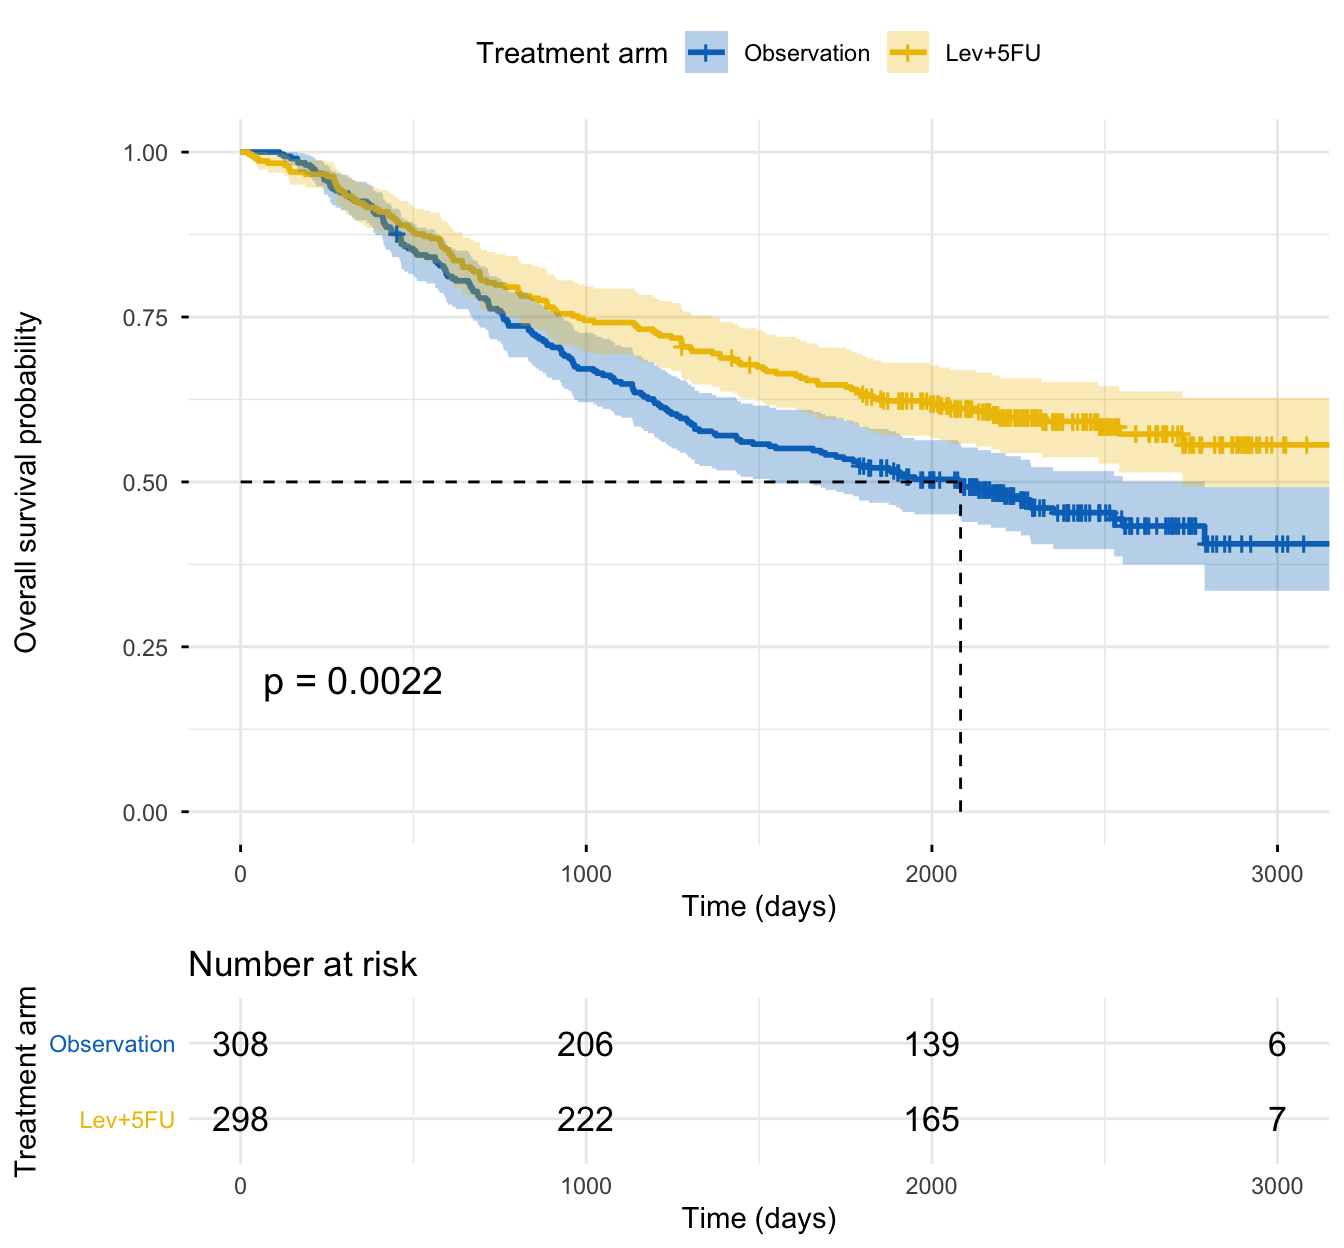
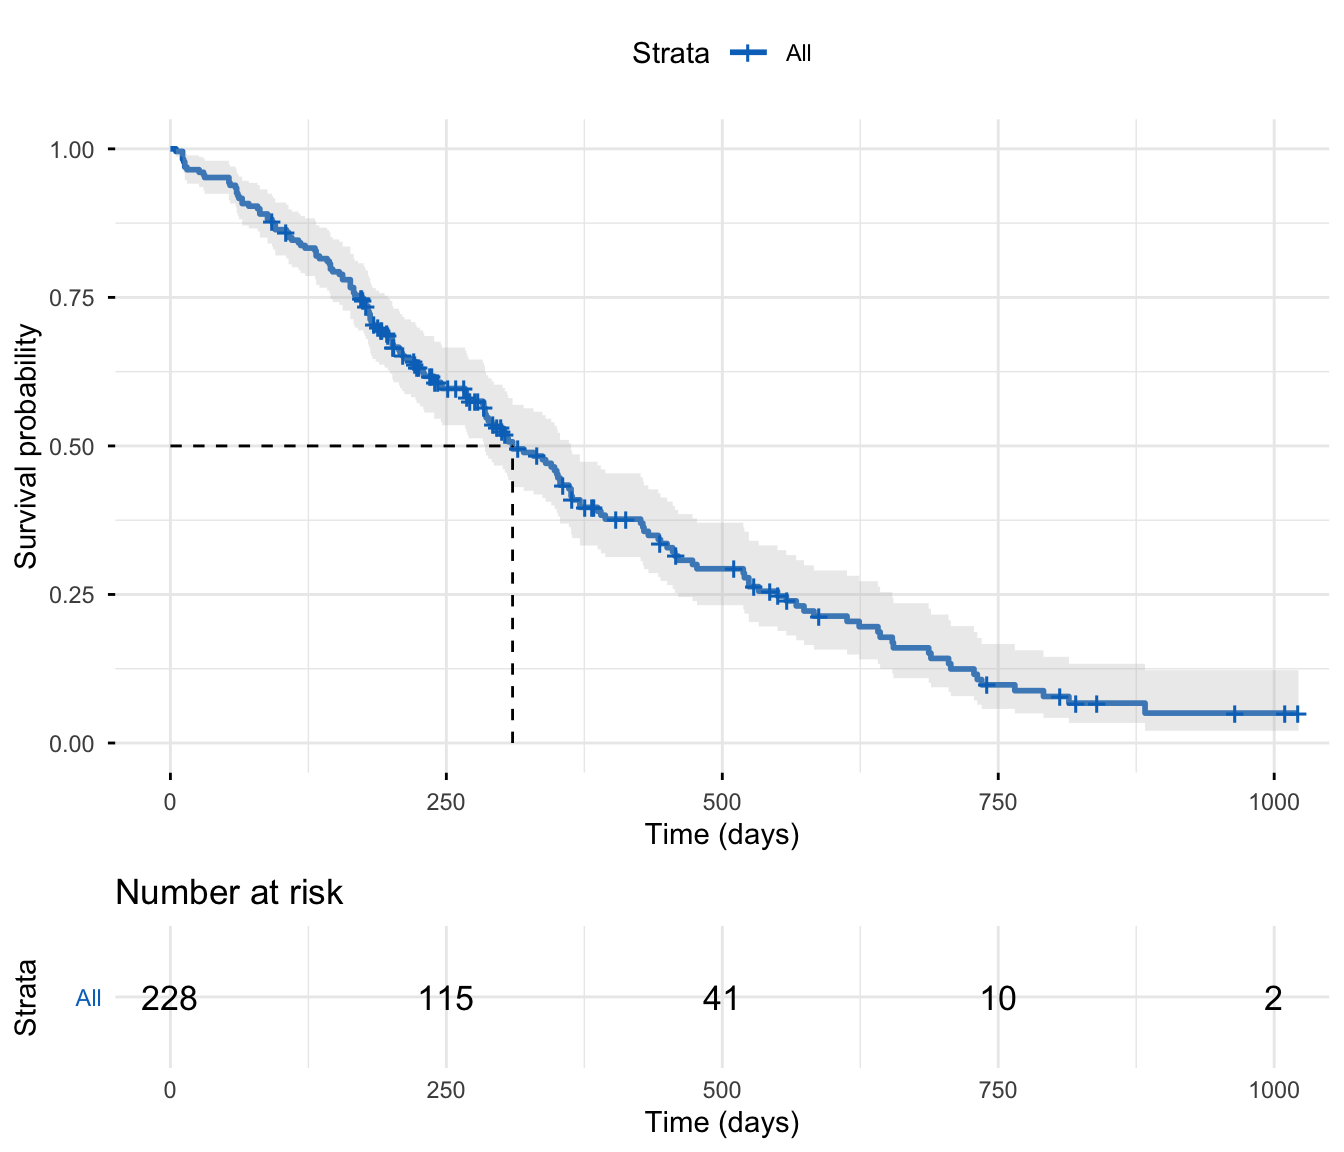
ggsurvplot with a risk table, confidence band, and the median line.ggforest plot — the workhorse of clinical survival analysis.The right tool depends on what you’re asking and what you have measured:
| Your question | Method | Start here |
|---|---|---|
| What does my time-to-event data even mean? | Concepts (censoring, hazard, survival) | What is survival analysis? |
| What’s the survival probability over time / the median? | Kaplan-Meier estimation | Kaplan-Meier |
| Do two or more groups survive differently? | Log-rank test | Log-rank test |
| How do covariates (age, sex, dose, biomarker) change the hazard? | Cox proportional-hazards | Cox regression |
Whatever you choose, the workflow is the same: build the Surv(time, status) object → estimate (KM or Cox) → draw the publication ggsurvplot (curves + risk table + CI + p-value) → interpret in plain language (median survival, log-rank p, hazard ratio with its 95% CI) → check assumptions → report.
This guide is filling in wave by wave — the high-demand free hooks first: what survival analysis is, Kaplan-Meier estimation, the log-rank test, and the Cox proportional-hazards model. Coming next: PH-assumption diagnostics, median survival and life tables, the survminer publication studio, stratified and parametric Cox models, and advanced topics (competing risks, restricted mean survival time, regulatory time-to-event).
Ask Prova “compare survival between my two groups and fit a Cox model on my data” — it answers with survival + survminer code you can run on your own data, then helps you read the Kaplan-Meier curve, the log-rank p-value, and the hazard ratios. The runtime is the judge. Ask Prova →
Prove you can do it. Master the whole Survival Analysis in R series — track your path, build projects, and earn a certificate.
Go Pro — unlimited Prova on your own data and a verifiable certificate that proves the skill.
from $15/mo billed yearly
✓ You're Pro — keep going. The runtime is the judge.
@online{untitled,
  author = {},
  title = {Survival {Analysis} in {R}},
  url = {https://www.datanovia.com/learn/biostatistics/survival-analysis/},
  langid = {en}
}